


“Delight,” in terms of customer satisfaction metrics, simply means going above and beyond for your customer in ways that make them feel especially recognized or rewarded. Tl;dr—delight is wowing your customer with an incredible experience.
To measure delight, you have to know your customer and chart their journey through the product or service you offer. A customer who is satisfied by an overwhelmingly positive experience is likely to spend 140% more after that experience than customers who report negative experiences.
One of the easiest ways to create a positive experience for customers is by tracking and using customer satisfaction metrics. They are the tea leaves you read to build and improve your future strategy. But which metrics are the most important? And which should you look for when determining how your CX team can build delight with customers?
These are some of the customer satisfaction metrics you should be paying attention to when building a strategy on how to give your customers the best experience you can and make them feel special in the process.
1. Customer Satisfaction Score (CSAT)
CSAT measures whether the customer likes your product or service on a scale of your choosing, but it usually ranges in scores of 1-3, 1-5, or 1-7. Some companies use emojis or icons (thumbs up, thumbs down) to rate, and then assign a numerical value to the icons.
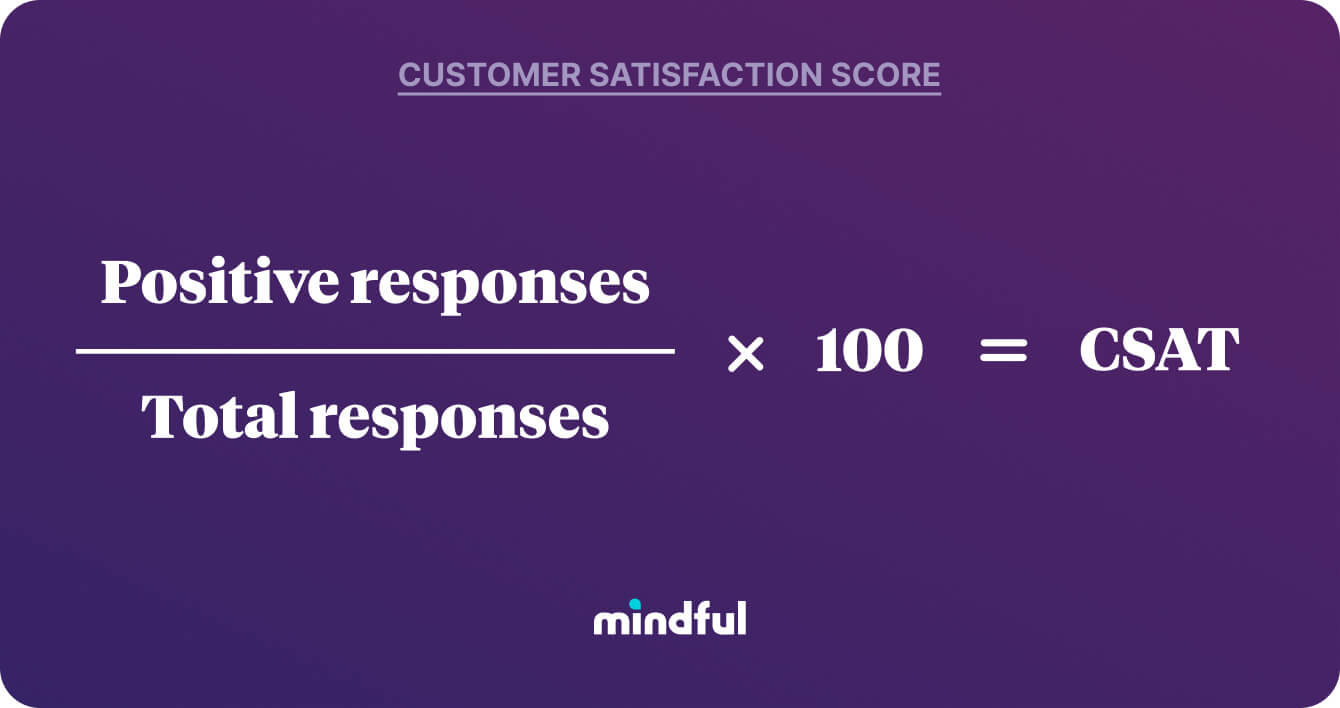
CSAT is calculated by taking the aggregate score of your two highest ratings, dividing it by the number of respondents, and multiplying that by 100. So, if you had 200 customers respond, and your top two ratings added up to 125 positive respondents, your CSAT formula would look like this:
Positive respondents (125) ÷ Total respondents (200) x 100 = 62.5
In this example, the formula yields a 62% CSAT score. That means 62% of your customers were satisfied or highly satisfied with your product or service. Used as a base score of a customer’s happiness, it’s the first step in creating delight for your customer.
But one caveat—a CSAT score is only one customer satisfaction metric, and, taken individually, it doesn’t give you enough data to help strategize ways to delight your customer. Let’s say 62% of your customers like your product. Why did they like it? Would they tell their friends?
And likelihood to tell a friend is exactly what NPS is based on.
2. Net Promoter Score (NPS)
The NPS (or Net Promoter Score) is a good growth indicator. It targets brand loyalty with questions like “How likely are you to recommend us to others?”
Customers are asked to rate (on a 0-10 point scale where 0 is the lowest and 10 is the highest) whether or not they will recommend you to others. Then you assign that group as Detractors, Passives, and Promoters.
- Detractors: not happy, most likely to negatively speak about your brand or service
- Passives: could care less and may switch brands
- Promoters: the ideal customer, happy, satisfied, loyal customers)
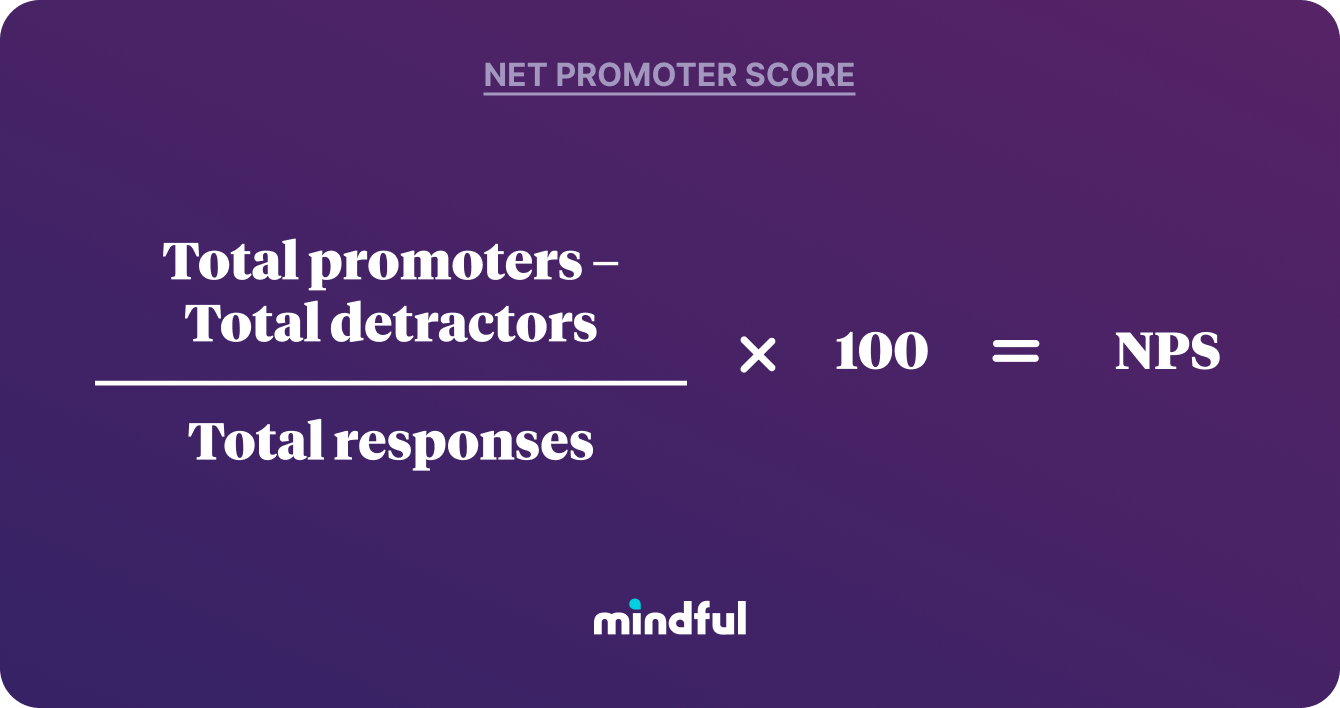
To calculate your NPS, you take the (Number of Promoters – Number of Detractors) / (Number of Respondents) x 100. So in the numbers from above, if out of 200 respondents, you had 80 promoters and 20 detractors, then you’d have an NPS of 30:
Promoters (80)- Detractors (20) ÷ Respondents (200) x 100 = NPS (30)
Anything below 0 is a problem. If your score is lower than 50, at least half your customers aren’t happy and won’t recommend you to their friends and family. Your CX team should address whatever problems are brought up with the NPS survey questions immediately, so you can start on a delight strategy for your service or product. A promoter has a lifetime value to a company that’s 6 to 14 times that of a detractor.
3. Customer Effort Score (CES)
The Customer Effort Score measures how much effort a customer has to expend to get something done with your company. This customer satisfaction metric could show where a pain point might present itself if customers are consistently rating the effort as being too high. The CES questions are usually along the lines of, “How easy was it to get your issue resolved today?”
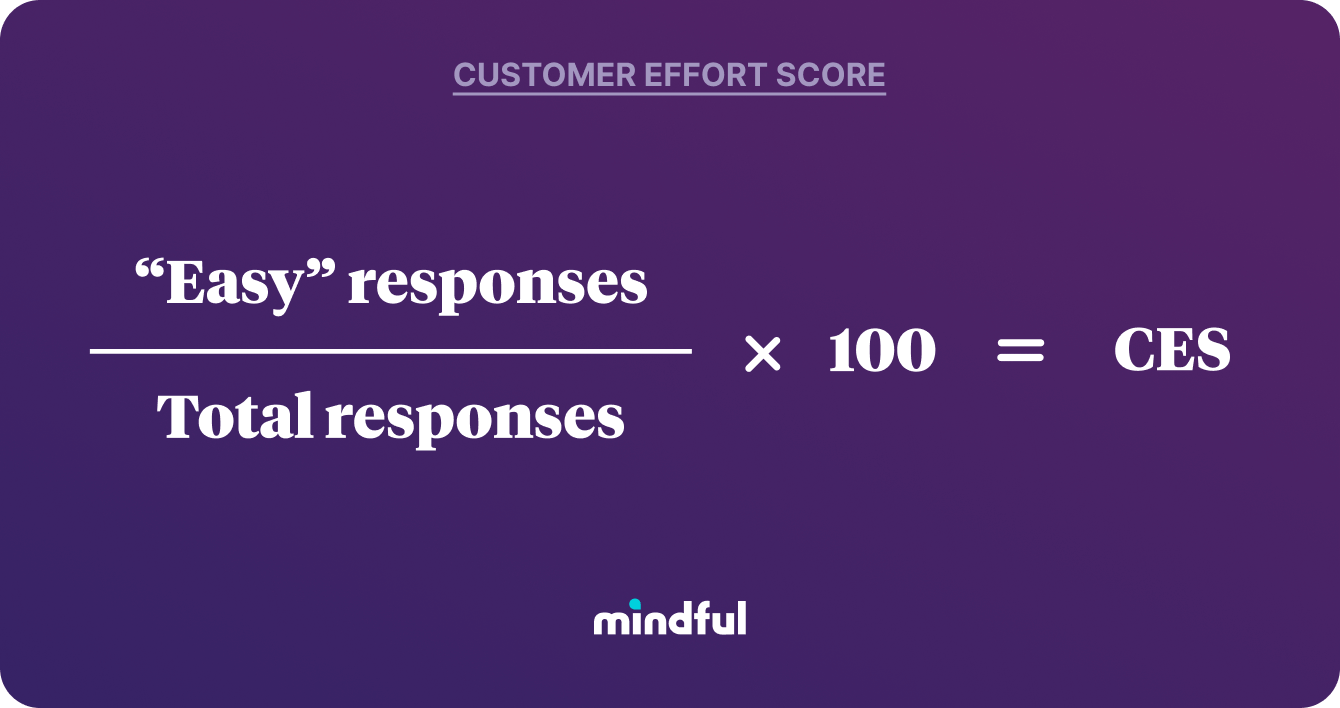
The easy way to calculate your CES is to total the two highest responses (e.g., Easy and Very easy) and divide by the total number of responses. Using our hypothetical numbers, if 200 respondents gave 75 positive responses, then 32.5% of your customers found your company or interaction was effortless to navigate:
Positive responses (75) ÷ Total responses (200) x 100 = 32.5
The effect of a low CES score is that customers will find it too difficult to deal with your brand and will likely find somewhere else to shop. In fact, 96% of consumers that reported “high effort” experiences (including conflict resolution or trying to give feedback) were disloyal to a brand, as compared to only 9% when the effort was minimized.
It can be an uphill battle to delight a customer who doesn’t think favorably of you.
4. Customer Retention Rate (CRR)
Customer retention rate is a simple concept—how many customers have you retained over time? The reason this customer satisfaction metric is important is that it’s seven times as costly to attract a new customer as it is to keep an existing one. Repeat buyers also, according to Bain & Company, spend more than new customers and drive new customers to your product or service.
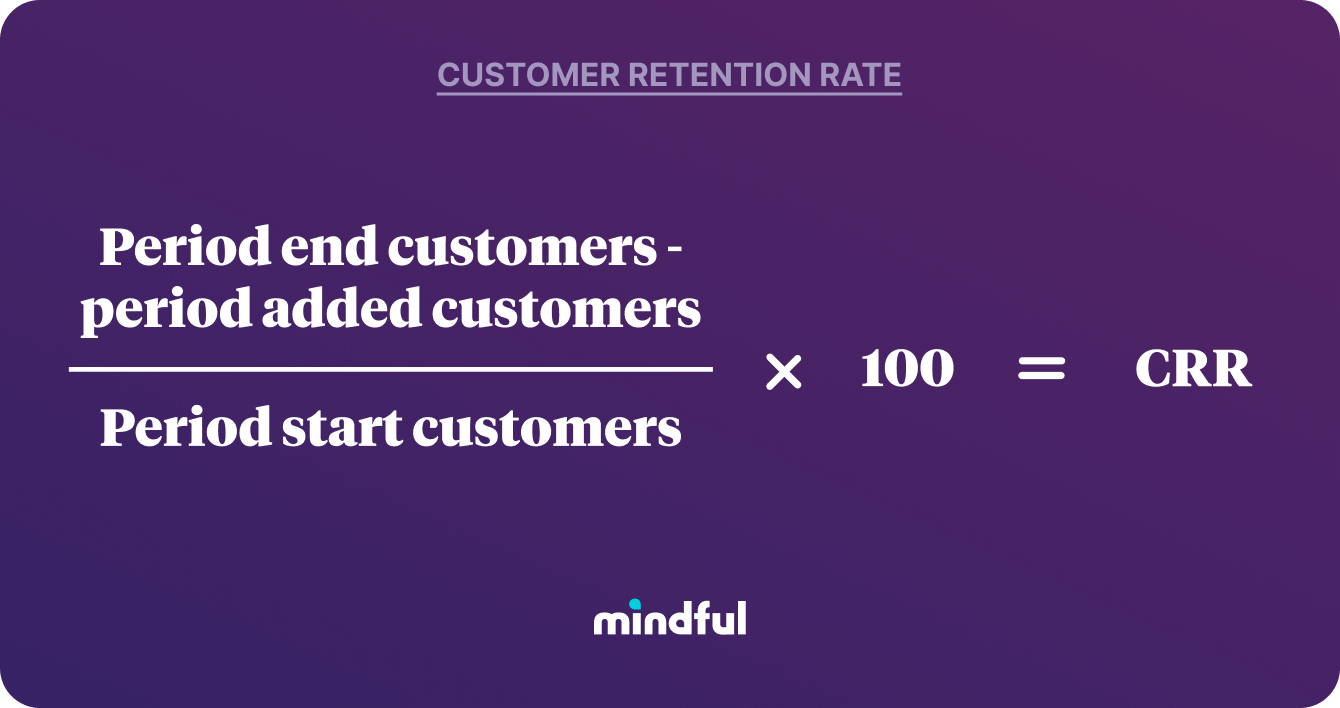
Measuring customer retention rate isn’t cut and dry, simply because the stats are fluid. Basically, you take the number of customers at the start of any given time period, the number of customers at the end of that time period, and the number of new customers added during the same time period:
End customers (90) – Added customers (10) ÷ Start customers (100) x 100 = CRR (80)
So, if you started with 100 customers, you ended with 90 customers, and you added 10 customers, your CRR is 80%. This metric helps anyone in the CX org—especially executives— identify the health and growth of a business.
Lower rates act as a siren telling you something needs to improve. And, just like the other customer satisfaction metrics, this cannot and should not be used as a single qualifying measure to determine strategy. The number only tells how many customers you’ve gained—not why (e.g., if they like your product or if they’re happy). If your retention rate is high, you can concentrate on strategies to delight. If it’s low, fix internal problems first.
5. Customer Churn Rate (CCR)
Customer churn rate, or just churn rate, is another customer satisfaction metric that, like customer retention, basically lets you know how many customers you’re losing over a given period. While it won’t dive deep into your customer’s psyche, it’s a good dashboard metric to measure against over time.
But identifying a usable churn metric has to take a lot of other factors into consideration. Did you lose customers during a trial period? Over a seasonal shift? Everything from a downturn in the economy to a natural disaster can skew churn numbers, leaving you with a scary number and no strategy to fight it—which is where it’s important to balance CCR with other customer satisfaction metrics.
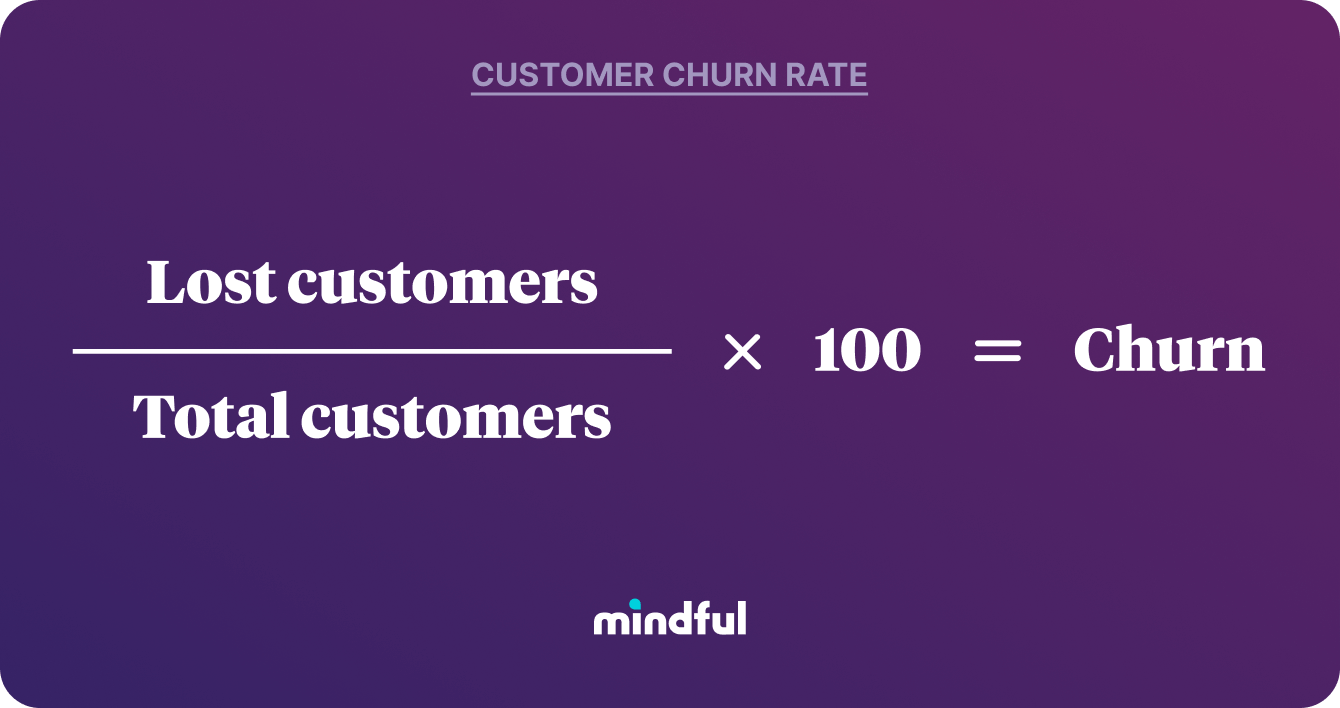
Churn calculation is fairly simple. You take the number of lost customers in a certain time period, divide by the total customers at the start of the time period, and multiply by 100:
Lost customers (1000) ÷ Total customers (5000) x 100 = Churn rate
In this example, let’s say you had 5,000 customers from June through December, you lost 1.000 of them, so we get a 20% churn rate for the six-month period.
In customer service, churn can be intimidating, but the factors around churn numbers are debatable. When used with CRR and other customer satisfaction metrics, it may give you a clearer picture of soft areas that need improvement. Even though this metric is the opposite of retention, the strategy remains the same: High churn means you concentrate on areas of improvement, and low churn means you can look at delight strategies.
6. Customer Lifetime Value (CLV)
Customer lifetime value is a customer satisfaction metric not often used, but when calculated gives you a good picture of a customer’s history. Instead of measuring what the customer is doing right now or recently, the CLTV calculates what the customer has meant to you during the lifetime of your interaction. It shows how much they’ve spent on average, for how long, and measures more than loyalty—it maps out a definite fiscal relationship that can help customer service teams strategize on retention.
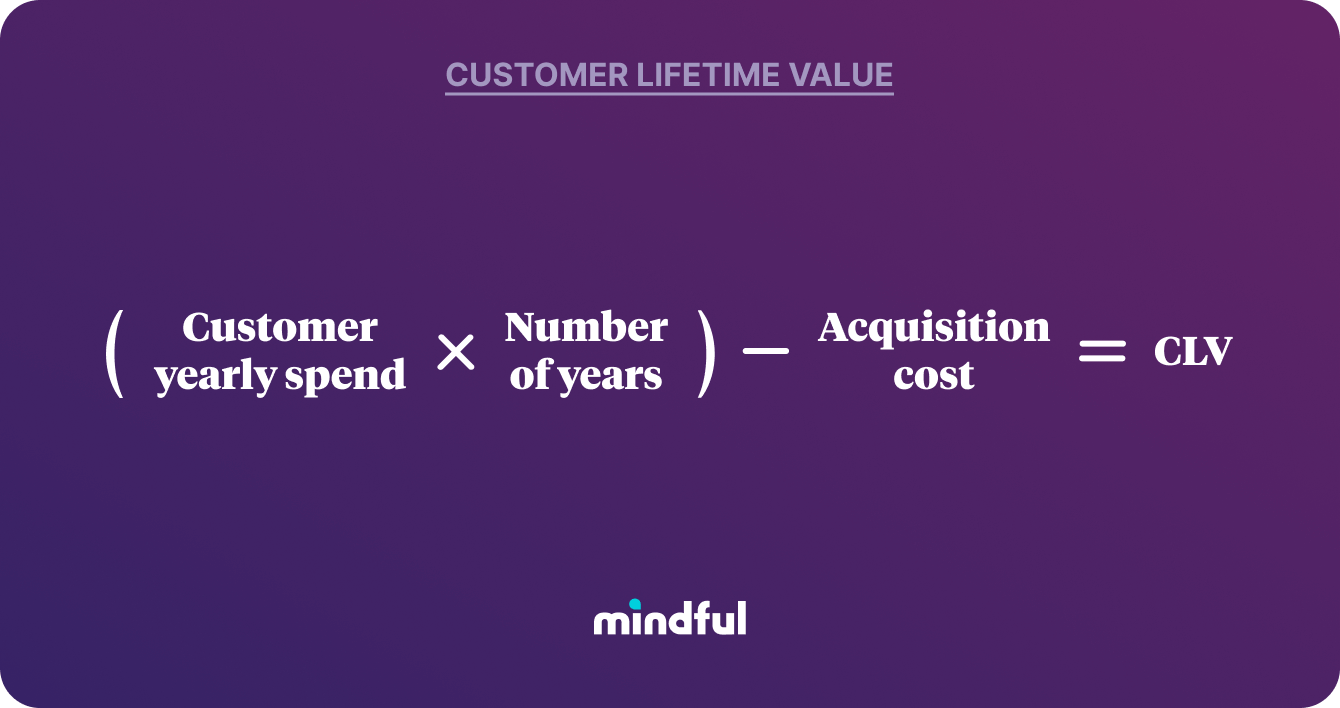
CLV requires having the spending history of a customer over time. To simplify, consider this scenario: A customer spends $5 on peanut butter every month for ten years, the customer’s initial value is $600. Then subtract your customer acquisition cost, let’s say $100. You also have to factor in inflation, the fluctuation in the cost of peanut butter, or inconsistency in buying patterns:
Customer yearly spend ($60) x Number of years (10) – Acquisition cost ($100) = CLV ($500)
This is why many companies don’t calculate CLV or take it seriously. But for CX professionals, this kind of empirical data could be invaluable when calculating delight strategies—and might help prioritize one customer persona over another based on CLV. Maybe send a jar of jelly their way for the holidays?
7. Average Handle Time (AHT)
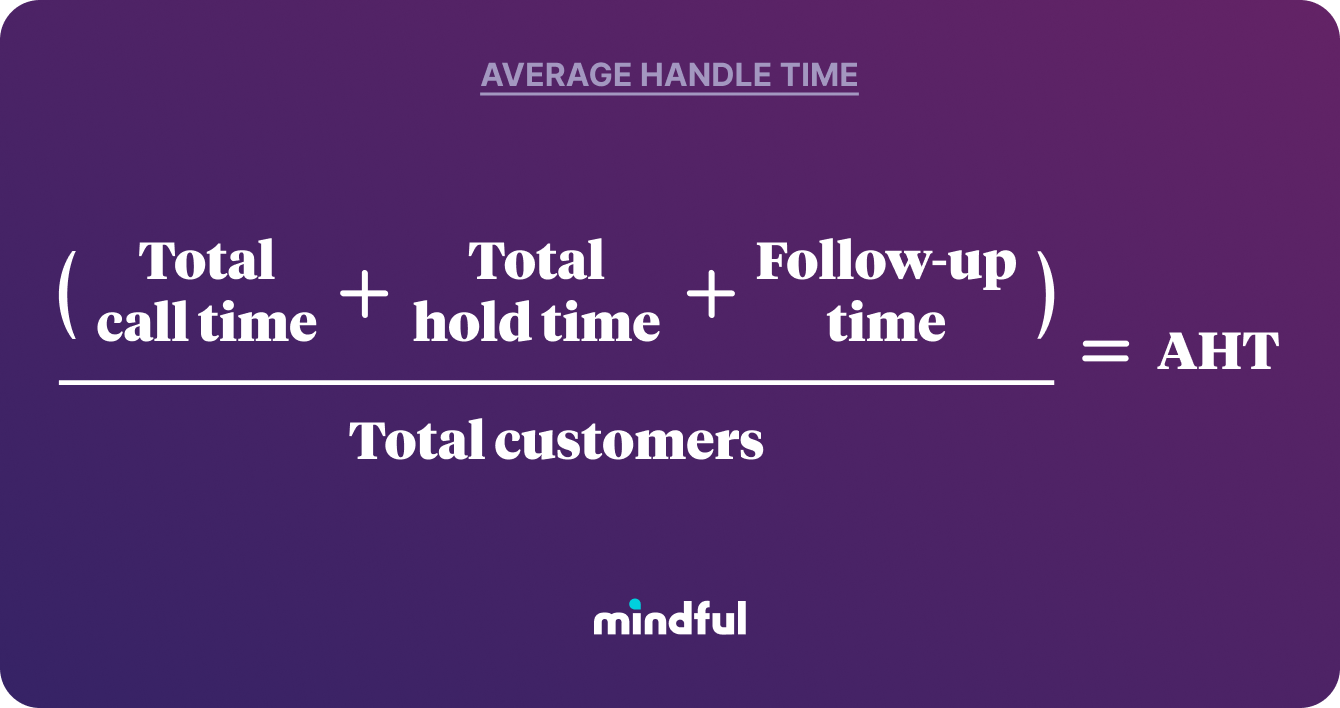
Average handle time measures the average amount of time an agent spends on each call or ticket they open. Call centers use it to measure chat and email queues as well, but also to find areas of improvement. It’s calculated with this very straightforward formula:
(Total call time + Total hold time + Follow-up time) ÷ No. calls = Average handle time
This customer satisfaction metric is used mostly for measuring a call center’s efficiency and in creating benchmarks for CX reps. But if your other metrics—CSAT, CES, or NPS—are low, you should definitely take a peek at the AHT of your call center team to see if improvements can be made there.
8. Average Resolution Time
This one is pretty straightforward. How long did your customer service rep take to answer a call? And how many calls did they answer? These two metrics matter if the problem with your customer delight strategy shows a glaring deficiency in call center times and wait times.
Total resolution time for all tickets solved ÷ No. tickets solved = Average resolution time
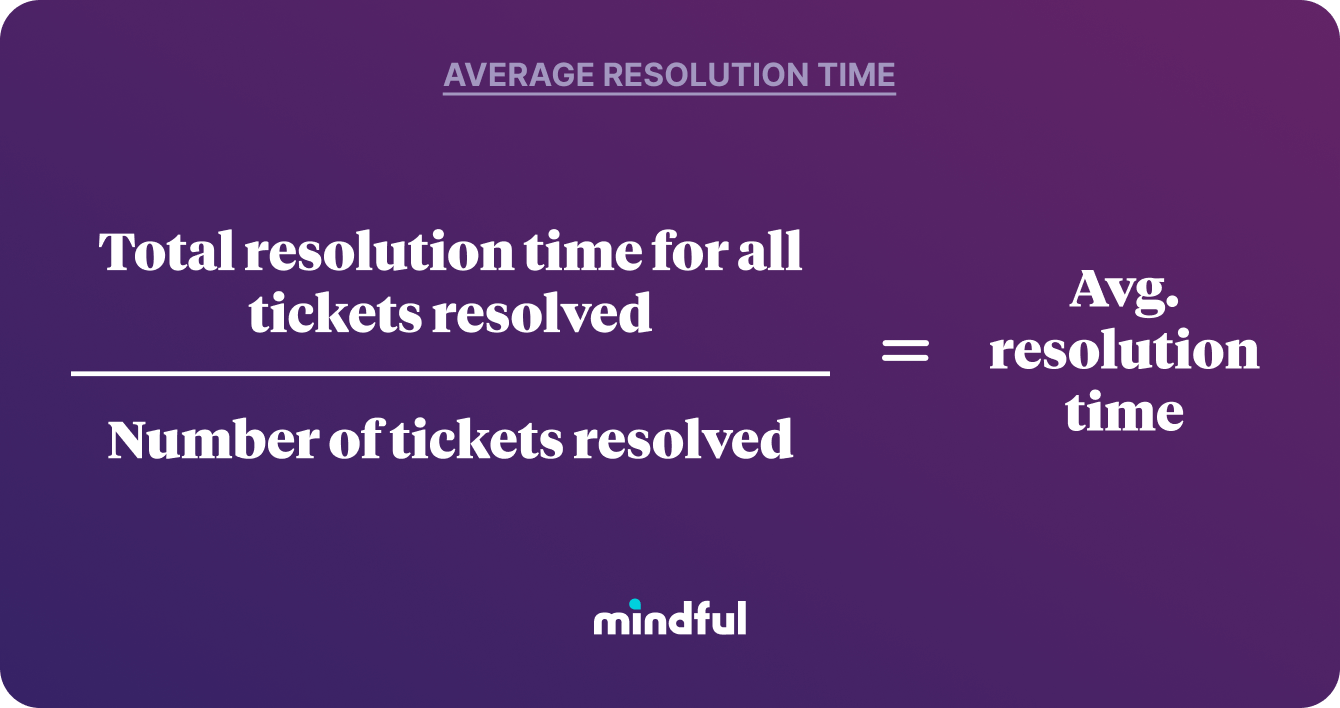
In 120 minutes, you solved 40 problems total. Your average resolution time is three minutes. When trying to establish delight concepts for your business, make sure these numbers stay in a manageable bracket.
Still digging into call center metrics? We wrote the book on ‘em—literally. Download your guide to call center metrics.
9. Average Hold Time
Average hold time is different than average handle time because this calculates the total amount of time a customer was on hold. This is the deal-breaker. This is the metric you want to keep an eye on because most likely long hold times will lead to customer dissatisfaction, which will lead to complaints—sometimes directly to your company’s social media outlet. Again, like Average Resolution Time, don’t waste time worrying about delight strategies if your hold time is enormous. Customers are already upset; pleasing them starts with getting the hold time down.
Since pioneering callback more than 25 years ago, we’ve found over the years that average hold time directly correlates to customer satisfaction and revenue. If customers have an efficient and positive phone experience, they’re more likely to recommend to a friend, and more likely to buy again in the future.
10. Social media
This is one metric that cannot be measured—it has to be maintained. You can log how many complaints you get on your social media page, but what do you measure it against? How much praise did you receive? This is why companies fiercely guard their social media pages. Vitriol can be immediate and aggressive, and that could lead to customers shying away—even if they don’t understand the whole situation.
A good customer service department should have a separate team that just answers the social media queries and relays problems or concerns back to the CX team. Customer delight can be measured by the feedback on your social media channels, and quick responses will definitely help that.
Summing up
Using customer satisfaction metrics will allow you to identify issues, resolve them, and effectively train your CX department to avoid these problems in the future. We learn from our mistakes, and proper use of customer satisfaction metrics will help minimize those mistakes down the road while giving you a guidepost on how to improve the customer experience for your product or company.
VHT and their Mindful Platform are helping companies use these metrics and find ways to minimize wait times and hold times. With innovations in virtual queuing and call-back technology, they’re turning hold into gold and helping companies boost NPS and CSAT scores along the way.